
Protect Species Well-Being
Type of resources
Topics
Keywords
Contact for the resource
Provided by
Years
Formats
Representation types
Update frequencies
status
-
This collection houses PDFs of active BBS route maps, which are grouped by province or territory. These maps allow BBS volunteers in Canada to easily locate the start of their route, and to navigate the official route. The BBS is jointly coordinated by Environment Canada's Canadian Wildlife Service and the U.S. Geological Survey (USGS), Patuxent Wildlife Research Center. Any use of BBS data for Canada should acknowledge the hundreds of skilled volunteers in Canada who have participated in the BBS over the years, those who have served as provincial or territorial coordinators for the BBS, and the Boreal Avian Modelling Project (BAM; www.borealbirds.ca), whose collaboration was invaluable to the creation of the BBS route and stop location dataset.
-
As part of a scientific assessment of critical habitat for boreal woodland caribou (Environment Canada 2011, see full reference in accompanying documentation), Environment Canada's Landscape Science and Technology Division was tasked with providing detailed anthropogenic disturbance mapping, across known caribou ranges, as of 2015. This data comprises a 5-year update to the mapping of 2008-2010 disturbances, and allows researchers to better understand the attributes that have a known effect on caribou population persistence. The original disturbance mapping was based on 30-metre resolution Landsat-5 imagery from 2008 -2010. The mapping process used in 2010 was repeated using 2015 Landsat imagery to create a nationally consistent, reliable and repeatable geospatial dataset that followed a common methodology. The methods developed were focused on mapping disturbances at a specific point of time, and were not designed to identify the age of disturbances, which can be of particular interest for disturbances that can be considered non-permanent, for example cutblocks. The resultant datasets were used for a caribou resource selection function (habitat modeling) and to assess overall disturbance levels on each caribou ranges. Anthropogenic disturbances within 51 caribou ranges across Canada were mapped. The ranges were defined by individual provinces and territories across Canada. Disturbances were remapped across these ranges using 2015 Landsat-8 satellite imagery to provide the most up-to-date data possible. As with the 2010 mapping project, anthropogenic disturbance was defined as any human-caused disturbance to the natural landscape that could be visually identified from Landsat imagery with 30-metre multi-band imagery at a viewing scale of 1:50,000. A minimum mapping unit MMU of 2 ha (approximately 22 contiguous 30-metre pixels) was selected. Each disturbance feature type was represented in the database by a line or polygon depending on their geometric description. Polygonal disturbances included: cutblocks, mines, reservoirs, built-up areas, well sites, agriculture, oil and gas facilities, as well as unknown features. Linear disturbances included: roads, railways, powerlines, seismic exploration lines, pipelines, dams, air strips, as well as unknown features. For each type of anthropogenic disturbance, a clear description was established (see Appendix 7.2 of the science assessment) to maintain consistency in identifying the various disturbances in the imagery by the different interpreters. Features were only digitized if they were visible in the Landsat imagery at the prescribed viewing scale. A 2nd interpreter quality-control phase was carried out to ensure high quality, complete and consistent data collection. For this 2015 update an additional, separate higher-resolution database was created by repeating the process using 15-metre panchromatic imagery. For the 30-metre database only, the line and poly data were buffered by a 500-metre radius, representing their extended zone of impact upon boreal caribou herds. Additionally, forest fire polygons were merged into the anthropogenic footprint in order to create an overall disturbance footprint. These buffered datasets were used in the calculation of range disturbance levels and for integrated risk assessment analysis.
-
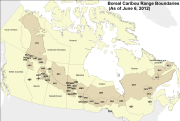
As part of a scientific assessment of critical habitat for boreal woodland caribou (Environment Canada 2011, see full reference in accompanying documentation), Environment Canada's Landscape Science and Technology Division was tasked with providing detailed anthropogenic disturbance mapping across known caribou ranges. This data allowed researchers to better understand the attributes that have a known effect on caribou population persistence. The mapping process was established to create a nationally consistent, reliable and repeatable geospatial dataset that followed a common methodology. The methods developed were focused on mapping disturbances at a specific point of time, and were not designed to identify the age of disturbances, which can be of particular interest for disturbances that can be considered non-permanent, for example cutblocks. The resultant datasets were used for caribou resource selection function,habitat modeling, and assess overall disturbance levels on each caribou ranges. Anthropogenic disturbances within 57 caribou ranges across Canada were mapped. The ranges were defined by individual Provinces and Territories across Canada. Disturbances were mapped across these ranges using 2008-2010 Landsat-5 satellite imagery to provide the most up to date data possible. Originally some areas were mapped to match the date of collected caribou demographic data, however more recent imagery was used and additional disturbance features that were seen since the original mapping date were added. Within the context of this project, anthropogenic disturbance was defined as any human-caused disturbance to the natural landscape that could be visually identified from Landsat imagery at a viewing scale of 1:50,000. A minimum mapping unit (MMU) of 2 ha or approximately 22 contiguous Landsat pixels was selected. Each disturbance feature type was represented in the database by a line or polygon depending on their geometric description. Polygonal disturbances included: cutblocks, mines, reservoirs, built-up areas, well sites, agriculture, oil and gas facilities, as well as unknown features. Linear disturbances included: roads, railways, powerlines, seismic exploration lines, pipelines, dams, air strips, as well as unknown features. For each anthropogenic feature type, a clear description was established (see Appendix 7.2 of the science assessment) to maintain consistency in identifying the various disturbances in the imagery by the different interpreters. Various ancillary vector datasets were used as aids in detecting, classifying and digitizing disturbances on the Landsat imagery (a table listing these datasets and their sources has been included in a separate file). Ancillary data was used to guide interpretation and feature labelling since the ancillary data was often variable across the country in terms of completeness as well as scale. As a result, features were only digitized if they were visible in the Landsat imagery at a viewing scale of 1:50,000. A 2nd interpreter quality control phase was carried out to ensure high quality, completete and consistent data collection. A quality assessment analysis, since an actual accuracy assessment was not possible, using high resolution SPOT imagery was carried out on a sample basis. Results are included in accompanying documentation. The vector data was buffered by 500m (radius) representing the zone of influence impacting boreal caribou herds in order to calculate range disturbance levels as well as for use in the integrated risk assessment analysis. Fire polygons were merged into the anthropogenic footprint in order to create an overall disturbance footprint.
-
The North American Breeding Bird Survey (BBS) is a road-based, long-term, continental survey that focuses on measuring breeding bird abundance at 50 stops along roughly 40-km long transects. This collection houses PDFs of active BBS route maps, which are grouped by province or territory. These maps allow BBS volunteers in Canada to easily locate the start of their route, and to navigate the official route. Once available, the collection will also house the GIS shapefiles for all active and discontinued route paths in Canada, and the current locations for all 50 stops along each transect. This collection also houses archived trend results and annual indices derived from analyses prepared by the Canadian Wildlife Service using BBS data for 2009, 2011 and 2012. A link for the most current BBS trend results is provided below under Supplemental Information. Raw BBS data are publicly available through through the USGS Patuxent Wildlife Research Center's website, at the link provided below under Supplemental Information. The BBS is jointly coordinated by Environment Canada's Canadian Wildlife Service and the U.S. Geological Survey (USGS), Patuxent Wildlife Research Center. Any use of BBS data for Canada should acknowledge the hundreds of skilled volunteers in Canada who have participated in the BBS over the years, those who have served as provincial or territorial coordinators for the BBS, and the Boreal Avian Modelling Project (BAM; www.borealbirds.ca), whose collaboration was invaluable to the creation of the BBS route and stop location dataset.
-
Sidney Island Shorebirds Survey peep counts.
-
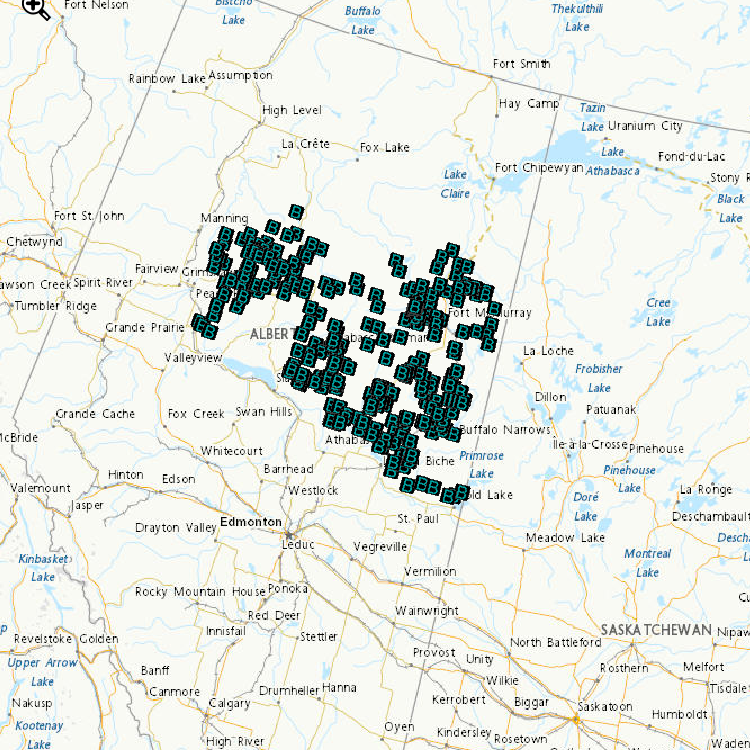
Environment and Climate Change Canada’s cause-effect monitoring is focused on understanding how boreal songbirds, including several Species at Risk, are affected by human activity in the oil sands area, particularly the impact of the physical disturbance of forested habitats from exploration, development and construction of oil sands. Determining the abundance of songbird species associated with various habitat type(s) and understanding how the type and number of birds varies with type and amount of habitat, are important components of assessing the effect of habitat disturbance. Regional-scale monitoring focuses on understanding how and why boreal songbirds, including several Species at Risk, are affected by human activity across the Peace, Athabasca and Cold Lake oil sands area. Local-scale projects focus on addressing gaps in our understanding of complex response patterns at regional scales by targeting specific habitats or development features of interest. These data contribute to: a. improving the design of monitoring programs; b. explaining observed trends in populations (why bird populations are increasing or decreasing); c. predicting population sizes within the oil sands area; and d. assessing the individual, additive and cumulative effects of oil sands and other resource development on boreal birds. Data are used by ECCC and our partners to develop new models and increase the robustness of existing models of bird responses to habitat and disturbance. Because models can be used to predict outcomes of future land management scenarios, these models can assist decision-making by helping evaluate land-use choices before impacts are directly observed.
-
The Point Lepreau Bird Observatory (PLBO), located in Point Lepreau, New Brunswick, was created as a project of the Saint John Naturalists’ Club (SJNC) in late 1995. The SJNC began accumulating data on bird migration through the Bay of Fundy in spring and fall in 1996. Migration data are collected daily using a sampling method with protocols adapted from Hussell and Ralph (1998). Migration counts using the Hussell and Ralph (1998) count protocol involve a four-hour Count Period consisting of a series of 15-minute counts, each followed by a rest period of equal length. Each Count Period consists of eight 15-minute counts, for a total of two hours, and eight 15-minute periods of rest. Observations are conducted from a permanent observatory building from mid-March to mid-May and from mid-September to mid-November. Observers count all birds seen and since Point Lepreau projects southward into the Bay, birds in spring migration are travelling east when passing it while birds in fall are travelling west. Since the year 2000, counts in spring have been under the supervision of a contracted Official Observer, normally assisted by up to three volunteers. The data are split in to a conditions file and an observations file. The conditions data includes information on weather conditions, sea states and times and durations of each count. The observations data includes observations of birds by species, including numbers of individuals observed and direction of flight. Birds travelling in different directions are recorded separately as are birds resting or feeding on the water.
-
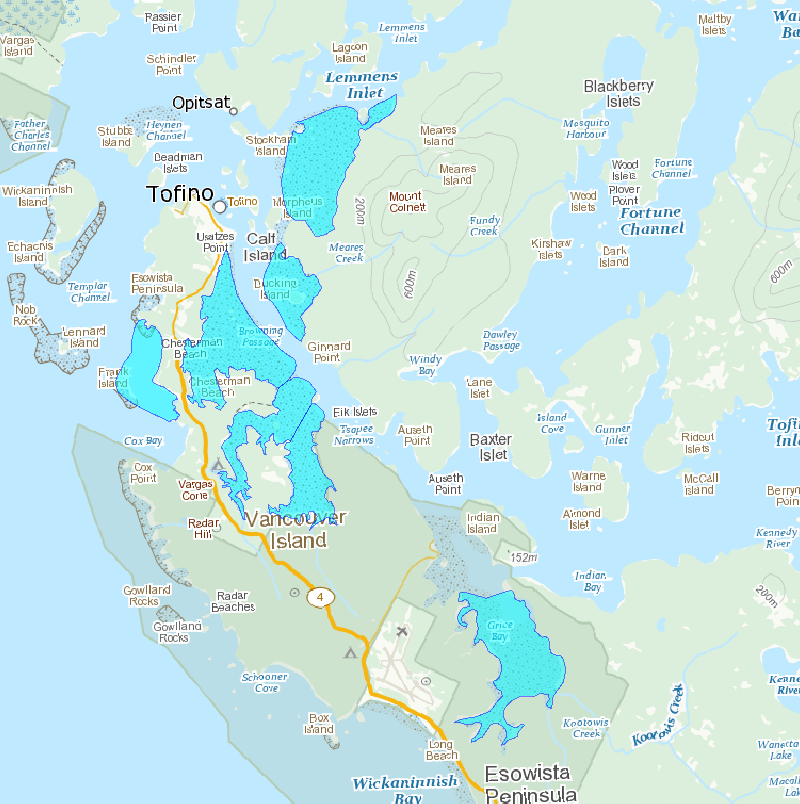
Survey areas is a polygon feature class containing mudflats and staging areas observed for shorebirds.
-
These surveys focus on two abundant shorebird species, Western Sandpiper (Calidris mauri) and Dunlin (Calidris alpina), and are conducted at a large mudflat on Roberts Bank, Delta, British Columbia, approximately 35 km south of Vancouver. These survey counts began in 1991 and are conducted annually during the northern migration period (April and May). Species-specific counts are derived from total flock counts multiplied by an estimate of percentage composition of the two species. The Brunswick Point study site (49°03′ N, 123°09′ W) extends over the southern third of Roberts Bank, and encompasses a large mudflat (tidal range = 0 – 3.8 m) separated from agricultural fields by a dike. Vegetation in the near shore sections of the mudflat is composed mostly of saltmarsh and bushes. Sediments in the mudflat range from soft mud to sand, and portions of the lower intertidal zone are covered with eelgrass (Zostera marina and Z. japonica). A causeway supporting a major port facility separates the mudflat from the remainder of Roberts Bank, and the dike is used for recreational purposes. Total flock counts. The number of total flock counts conducted annually varied from seven to 15 counts from 1991 to 1998. Beginning in 1999, counts were conducted either daily or every other day during spring migration for an annual replicate of 17 32 counts. The migration period began on 15 April each year and continued until lesser than 1000 birds were observed or until 15 May, whichever came first. This timing was chosen to overlap with the major pulse of Western Sandpiper migration and also captured peak Dunlin numbers. Daily timing of surveys depended on the tide cycle; the start of surveys ranged between 05:45 and 19:00 hr. Counts were conducted at a tide height of 3.5 m, based on tidal predictions at Point Atkinson, British Columbia. This tide height ensured birds were close to shore, with sufficient mudflat exposed to present good feeding opportunities for shorebirds. Occasionally maximum daily tide heights did not reach 3.5 m, and counts on these days were conducted during the actual maximum tide heights. Counts began at the southern end of the Brunswick Point dike where it meets the Roberts Bank Superport causeway. All birds visible on the mudflat were counted from a vehicle along a series of stops on the dike, for a total length of ~2.5 km. Birds were counted through a spotting scope mounted on the vehicle window, primarily for distant flocks, and through binoculars to count birds near the vehicle. Flocks were counted by an initial assessment of flock density, and then by counting blocks incrementally in 50s, 100s, 500s, or 1000s, according to flock size, in each successive field of view across a scan of the entire flock. In 1992, the number of birds in large flocks was estimated by multiplying the number of square metres of mudflat covered by the flock by the average number of sandpipers in several 1-m2 plots estimated by eye (Butler 1994). Species composition: Only total flock counts were conducted prior to 1997, as deriving species-specific counts was complicated by the intermixing of Western Sandpipers and Dunlin in the large flocks. Species-specific counts are calculated as a product of total flock counts and percentage composition of different species. From 1997 onwards, relative species composition (ratio of Western Sandpipers to Dunlins) was estimated during supplementary counts as birds settled on the mudflats before or after the main shorebird counts described above. Numbers of Western Sandpipers and Dunlins were individually tallied along visually estimated 1 m wide strips that ran perpendicular from the dike to the water’s edge, and included both open mudflat and shallow water. Tallies of all strip counts were summed and the species proportion for that day was calculated as the number of each species counted divided by the total number of birds.
-
Survey transects is a line feature class containing transects completed in 2011.